NOK - NORWEGIAN KRONE
Definition: NOK is the currency symbol for the Norwegian Krone. The Norwegian Krone is the currency of Norway.
NZD - NEW ZEALAND DOLLAR
Definition: NZD is the currency symbol for the New Zealand Dollar. The New Zealand Dollar is the currency of New Zeland.
PLN - POLISH ZLOTY
Definition: PLN is the currency symbol for the Polish Zloty. The Polish Zloty is the currency of Poland.
SAR - SAUDI RIYAL
Definition: SAR is the currency symbol for the Saudi Riyal. The Saudi Riyal is the currency of Saudi Arabia.
SEK - SWEDISH KRONA
Definition: SEK is the currency symbol for the Swedish Krona. The Swedish Krona is the currency of Sweden.
TRY - TURKISH LIRA
Definition: TRY is the currency symbol for the Turkish Lira. The Turkish Lira is the currency of Turkey.
TWD - TAIWAN DOLLAR
Definition: TWD is the currency symbol for the Taiwan Dollar. The Taiwan Dollar is the currency of Thailand.
USD - US DOLLAR
Definition: USD is the currency symbol for the US Dollar. The US Dollar is the currency of the United States of America.
ZAR - SOUTH AFRICAN RAND
Definition: ZAR is the currency symbol for the South African Rand. The South African rand is the currency of South Africa.
<<<PREVIOUS PAGE
1 2 3
TECHNICAL ANALYSIS
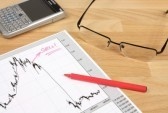
One of the best reasons to learn how to read a chart properly is so you can apply technical analysis. Not every trader believes in using technical analysis, but it can be useful, even if it is not your primary method of trading. Technical analysis relies on the price that is on the chart you are using. Most charting systems will allow you to add technical analysis tools as overlays on your chart.
Understanding Support And Resistance

The concept of support and resistance is simple. Support can be thought of as a floor for the price while resistance can be thought of as the ceiling for the price. When the price breaks through a resistance, that level becomes the new support level. The reverse is true when the price breaks through a support level.
The best use of support and resistance is during trend trading. If the trend is up, you want to go long at support and take profit at resistance. If the trend is down, you want to go short at resistance and take profit at support.
Support and resistance levels are sometimes not exact price levels. Many times, they will be a small range of prices. Once the price clearly breaks past that range of prices, support or resistance is to be considered broken.
Support and resistance should be used as reference points when looking at a forex chart and trying to make a decision. They can give you a good idea of where to put your stop loss or take profit orders.
Technical Analysis
Technical analysis is the study of charts and indicators to determine the past and future price movement of a currency pair. Unlike fundamental analysis , technical analysis relies on the use of charts and mathematical techniques to examine various aspects of a currency pair’s price movement. With the growth of the Internet, technical indicators that were once available only to brokers and professional traders are now available to any trader with a computer.
What Do Charts Tell Me?
Charts can provide a lot of information about the price movement of a currency pair. Many traders say that a chart tells a story about the currency pair. With more than 50 types of technical indicators , a trader can receive a wealth of information about how a currency pair is moving. From this historical information, the trader can deduce the future movement of a currency pair.
Support and Resistance
Most traders are looking for support and resistance lines to tell them where and how the currency price is likely to move. A support line lies below the currency pair price. A resistance line lies above the currency pair price. Depending on the strength of these lines, prices tend to trade between the support and resistance levels, bouncing off one and heading towards the other. Support and resistance lines are basic types of trend lines that can be determined by the moving average lines or by more complex technical methods.
Trends
Many traders will also be looking for a trend line. A trend line shows how a currency pair price is moving (or trending) – up, down, or sideways. Finding a trend can be very helpful in determining future price movement. The saying that “the trend is your friend” is quite true and many traders rely on the existence of a trend to predict price movements.
TECHNICAL INDICATORS
Definition: A technical indicator is a graphical representation of price action. Technical Indicators can appear at the bottom of the chart or on top of the price.
Examples: Technical indicators are often used in forex trading.
A technical indicator studies a particular aspect of a currency pair. Technical indicators are very similar to economic reports in that they study the health and movement of a currency pair while economic reports study the health and growth of an economy. Some technical indicators are basic such as the moving average line . Other indicators are complex calculations like Bollinger Bands or the MACD .
Number of Indicators
Traders can use many different kinds of indicators or they can focus on a few. Most experienced traders will focus their efforts on using only a few types of technical indicators to provide them with the information needed to trade.
Why Use Technical Analysis?
Technical analysis provides information on the best entry and exit points for a trade. On a chart, the trader can see where momentum is rising, a trend is forming, a price is dipping or other events are developing that show the best entry point and time for the most profitable trade. With the constant movement of various currencies against each other in the Forex market, most traders will focus on using technical indicators to find and place their trades.
Is Technical Analysis Difficult?
Technical analysis is not difficult, but it requires studying different types of charts such as the hourly or daily charts, knowing which technical indicators to use and how to use them. Computers and the Internet have made this process much easier. Most brokers provide basic charts and technical indicators for free or at a very low cost. One way to avoid getting frustrated by all the lines, colors, and graphics is to focus on using only a few indicators that will provide you with the information needed. Try not to clutter your chart with too much information.
Remember that the chart is telling a story.
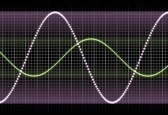
INTRODUCTION TO MOVING AVERAGES

Moving averages are one of the most commonly used technical indicators in forex trading. The moving average helps traders to track the overall pricing trend of a currency. It is called a moving average because it incorporates the new pricing data as it develops.
Main Objective
The main objective of moving average is to give you a simple view of the trend. The moving average can reduce the amount of “noise” and the chart and give you a simple direction to base your trades on.
Time Period Options
Moving averages come in several different flavors. They can be adjusted for the level of average that you want. If you are trading on an hourly chart, you can set a moving average that will give you the average price over the past 8 hours. This is called an 8 period moving average. Traders develop their own theories on what average works best for them. It’s best to experiment with different settings until you find one that makes sense to you.
Types of Moving Averages
SMA – Simple Moving Average
A simple moving average is the most basic style of moving average. It simply tracks price data as it occurs and gives you the average direction based on the time period you select.
WMA- Weighted Moving Average
A weighted moving average focuses on more recent price action. The moving average line will consider recent price movements to be more important than older price movements. This is also commonly referred to as an exponential moving average or EMA.
Using moving averages alone is not a catch all solution, but they will help you determine the overall trend. Used in conjunction with your other preferred technical indicators, they are an asset to any trading system.
<<<PREVIOUS PAGE
1 2 3
<<HOME>>
<<GO TOP>>
Risk Disclaimer
“Trading in the Forex market is one of the riskiest forms of investment
available in the financial markets and suitable for sophisticated
individuals and institutions. Nothing in this presentation is a
recommendation to buy or sell currencies and FXcharles is not liable for
any loss or damage.”


 Definition: EUR is the currency symbol for the Euro. The Euro is the official currency for the countries that make up the European union.


 Fundamental traders use information about the global and national economies, and the financial state of the companies involved, as well as non financial information such as current political and weather information. Fundamental traders believe that the markets will react to events in certain ways and that they can predict future market prices based on these events. For example, if a company receives regulatory approval for a new product, a fundamental trader might expect the company's stock price to rise. Conversely, if a company has a financial scandal, a fundamental trader might expect its stock price to fall. Fundamental traders need access to all of the available information as soon as it is available, and are therefore often institutional traders with large support teams, rather than individuals. Fundamental analysis has probably been in use since there were markets to trade, and has traditionally been done manually, but as computing power increases it has become possible for some fundamental information to be processed automatically.
 T
T When day trading, a trader makes the decision about what to trade, when to trade, and how to trade, using either fundamental or technical analysis. Both forms of analysis involve looking at the available information and making a decision about the future price of the market being traded, but the information that is used is completely different. Is it possible to use both fundamental and technical analysis together, but it is more common for a trader to choose one or the other.